

Have you ever thought that a quick look at a chart might hint at your next crypto move?
Crypto charts often send clear signals that hint at upcoming market swings.
They show when buyers and sellers come together, much like checking a weather forecast before you head out.
When you understand these signals, your buying and selling choices can feel a lot more confident and clear.
Using tools like support levels and moving averages (which show the average price over time), these charts give you a simple guide through the ups and downs of digital coin trading.
Keep reading to learn how these patterns can lead you to smarter trades.
2. crypto chart patterns: Sharp Signals
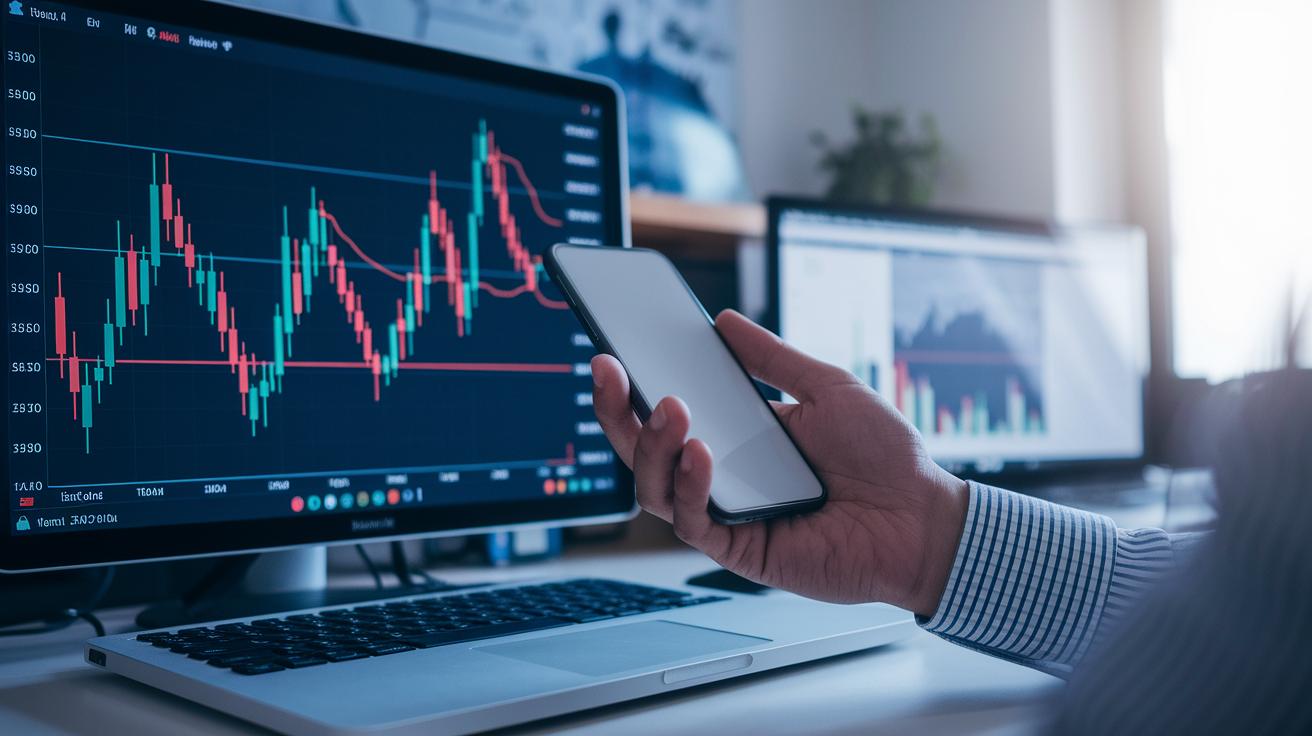
Crypto chart patterns give us clear hints about where the market might go next, making it easier to decide when to buy or sell digital coins. They show us the ups and downs in price by marking key spots where buyers meet sellers. Think of it like checking the day’s weather by glancing at a simple report, candlestick charts quickly show you the price high, low, open, and close.
There are five basic patterns every trader should know. First, support and resistance zones mark the levels where prices tend to bounce back or pause, hinting at strong buyer or seller activity. Second, trend channels, framed by parallel lines, help you see the top and bottom lines of a price move, giving clues about what might come next.
Then, triangle formations appear when the market seems unsure, often setting up for a big move later. Fourth, moving average overlays smooth out all the price data, like putting a clear filter over a messy picture to reveal the true trend. Lastly, RSI oscillations (a tool that shows if an asset might be overbought or oversold by comparing recent gains and losses) warn you when a price might be due for a shift.
For instance, if you notice the price keeps bouncing near a flat line, it could be a sign that the market’s mood might flip soon. These patterns, seen on clean and detailed candlestick charts, are like a handy toolbox for anyone tracking crypto trends and getting a feel for market moves.
Core Classifications of Crypto Chart Patterns

Crypto chart patterns act like clear signs that help traders grasp the market's mood. In simple terms, reversal patterns hint at a possible change in direction, while continuation patterns show that the current trend might keep going.
Consider the head and shoulders pattern. This classic reversal signal features two smaller peaks (the shoulders) flanking a larger peak (the head). The line connecting the lows, the neckline, is key. When prices dip below this line, it may signal that the bullish trend is losing steam.
Next, there’s the double top pattern, which looks like an "M". Here, prices hit a similar high twice, as seen with Bitcoin's peaks around $64,800 and $64,000, before dropping below a crucial support level, often near $47,000. In contrast, a double bottom pattern forms a "W" and points to a bullish turn when prices find support twice and then climb above an interim high.
Other reversal signs include ascending and descending triangles. An ascending triangle shows rising lows against a flat resistance line and often breaks out on higher volume, giving a bullish cue. On the other hand, a descending triangle features shrinking highs with a steady support line, suggesting seller strength and a potential bearish move.
Continuation patterns like bull flags and bear flags also play their part. A bull flag forms as a small downward-sloping channel after a strong uptrend, hinting at another boost when prices break upward. A bear flag, in contrast, appears as a short upward-sloping channel following a sharp drop and supports the idea of further decline. Additionally, pennants are neat, balanced triangles that form after a quick price move and signal that the current trend might persist. Lastly, the cup and handle pattern, with its rounded cup and slight consolidation handle, suggests a bullish resumption once a breakout occurs.
Step-by-Step Crypto Chart Pattern Tutorial

Learning to read crypto charts doesn’t have to be a mystery. In just six simple steps, you can start spotting key patterns in candlestick charts and build your confidence in the crypto market. Begin by learning what each pattern means and getting a feel for the ups and downs of the market. This makes it easier to see how price moves are formed and find clues in past trends. For instance, studying Bitcoin’s double top from 2021 can help you catch similar patterns in altcoins and other digital assets.
Choosing the right charting platform is important. Good tools let you switch from a 4-hour view for quick signals to a daily chart that shows overall trends. By mixing these tools with a review of past market moves, you can better understand why each pattern happens.
Below is a six-step guide to start your own chart pattern tutorial:
- Get a grip on the basics of patterns and market psychology. Learn why prices move the way they do and how trader feelings drive these moves.
- Pick a candlestick chart and a time frame that makes sense, like the 4‑hour or daily view. A clear, simple layout helps you spot familiar patterns.
- Mark key support and resistance levels. These price points reveal where buyers and sellers often step in.
- Look back at historical charts of Bitcoin and altcoins to find real examples of these patterns. Seeing past moves helps make sense of today’s trends.
- Check that the pattern is solid by looking at volume and RSI (a tool that shows momentum). Strong volume or changes in momentum back up the signal.
- Practice your entries and exits on a demo account before trading with real money. This way, you build your skills without any risk.
Follow these steps to turn technical patterns in altcoins into a clear, everyday guide for trading digital assets.
Advanced Crypto Chart Pattern Techniques

Confirmation tools help you be sure about crypto chart patterns. Daily moving averages smooth out price data and cut through random price swings to show the true trend. When you spot a pattern like head and shoulders, see if the moving average backs it up. For instance, if the moving average turns downward during this pattern, it might signal a strong reversal.
RSI is another handy tool that shows whether the market is too high or too low. An RSI above 70 warns of overbought conditions, while below 30 points to oversold territory. It works like a traffic light, telling you when to check your speed. Imagine the RSI dipping below 30 as a bearish pattern forms, it could be your cue to prepare for a decline.
Volume is also key. A burst in volume during a breakout gives extra weight to the pattern, confirming that the move isn’t just random. When you add candlestick overlays with these tools, you get a clearer, easier-to-read picture of price action than with plain line or bar charts.
Try layering these indicators for a stronger analysis. If you spot a head and shoulders pattern, check the moving averages, then the RSI, and finally look for any volume spikes. It’s like using multiple locks on your door for extra security. For more detail on these techniques, you can check out this guide: https://nftcellar.net?p=1394.
Crypto Chart Pattern Trading Strategy Blueprint

Crypto chart patterns show clear signals in the market. They help you see when a trend might keep going or change direction, guiding your decisions on when to enter or exit a trade. Think of these patterns as simple instructions before you jump into a market that can feel unpredictable. Remember, no pattern works every time, so adding risk tools like stop-loss orders is smart.
Consider the head and shoulders pattern. This classic setup often signals a market reversal. When the price falls below the neckline, it hints that buyers are running out of steam. In this scenario, you’d start your trade once the price closes below that line and set your stop-loss just above the right shoulder. Similarly, the double bottom pattern sends a bullish message. When the price climbs above the midpoint high, it may be gearing up for an upward move. Still, placing a stop-loss below the second bottom helps guard against sudden reversals.
Trend continuation patterns also play a key role in building your strategy. Take the ascending triangle, for example. A breakout above flat resistance, especially with good volume, is a solid signal to buy, just remember to set your stop-loss below the last higher low. The bull flag pattern suggests that the price might take a brief pause before rising again; you enter when the price breaks above the flag’s top trendline and use a stop-loss under the flag’s low. The cup and handle pattern works much the same way. It signals a bullish move when the price breaks above the cup’s rim, so manage your risk by keeping a stop-loss below the handle.
| Pattern | Signal | Entry Rule | Exit Rule |
|---|---|---|---|
| Head and Shoulders | Reversal | Enter when price closes below neckline | Set stop-loss above right shoulder |
| Double Bottom | Bullish Reversal | Enter on break above midpoint high | Set stop-loss below second bottom |
| Ascending Triangle | Bullish Continuation | Enter on breakout above resistance with volume | Set stop-loss below last higher low |
| Bull Flag | Continuation | Enter on breakout above flag’s upper trendline | Set stop-loss below flag low |
| Cup and Handle | Bullish Continuation | Enter on breakout above handle rim | Set stop-loss below handle low |
Integrating Crypto Chart Patterns into Market Analysis
Chart patterns really shine when you pair them with live news, market mood data, and a full look at the overall market structure. You can mix in trendlines, moving averages, volume figures, and RSI readings (a tool that shows how fast prices change) to figure out the best time to jump in or back out. When you watch these technical tools along with current market conditions, it becomes easier to spot when a pattern is backed up or challenged by other factors.
Live sentiment data, like what you get from market sentiment indicators, can either confirm or question what your charts are telling you. For example, if a bearish reversal pattern pops up and the mood seems gloomy, it strengthens the case for a drop. On the other hand, if a bullish pattern shows up while market sentiment is upbeat, it might be the perfect moment to buy. Many traders also love live chart platforms that send alerts as soon as patterns form, so they can catch key shifts right away.
By blending different tools and data sources, you build a deeper, multi-layer analysis that cuts down on guesswork. This balanced approach makes your trading setup feel more secure because you’re not just relying on a static chart, you’re also checking live market sentiment and structure for extra insight.
Final Words
In the action, this guide walked through basic crypto chart patterns and detailed how to use them in everyday trading. It broke down key classifications, step-by-step tutorials, and advanced techniques into clear, relatable pieces. It also offered a solid blueprint for risk management and market analysis. This easy-to-follow approach lets you blend real-time insights with careful planning. Use these crypto chart patterns to empower your financial decisions and build lasting confidence in your investments.
FAQ
Where can I find crypto chart patterns PDFs, free downloads, and cheat sheets?
The term ‘crypto chart patterns pdf’ points to downloadable guides that explain key technical signals found on candlestick charts. These resources often serve as cheat sheets and even come as free downloads in some cases.
What does crypto chart patterns AI refer to?
Crypto chart patterns AI refers to using artificial intelligence to spot, analyze, and filter chart patterns automatically. This tech aims to help traders quickly sift through data for actionable trading signals.
What is the best chart pattern for crypto?
The question about the best chart pattern refers to choosing patterns that clearly highlight support, resistance, and trend shifts. Many traders favor candlestick patterns for their detailed view of price action.
Can you make $100 a day with crypto?
The idea of making $100 daily with crypto implies it’s possible with skill. However, success depends on market volatility, proper risk management, and effectively applying technical pattern analysis.
What is the 1% rule in crypto?
The 1% rule means traders risk no more than 1% of their total account per trade. This practice helps limit losses and protect your overall capital when engaging in volatile crypto markets.
Are crypto chart patterns reliable?
Saying crypto chart patterns are reliable means they work as useful guides for spotting potential trend shifts. Still, pairing them with other tools and strong risk management is essential for better trading decisions.


