

Ever wondered if watching crypto charts could boost your trading? Crypto technical analysis uses past price trends (kind of like studying a weather forecast) to hint at what might happen next. It’s like checking your local forecast, you look at past patterns to guess if it might rain. In the wild world of crypto, this approach can help you find the right time to act. Think of key chart signals as stop signs on a busy street, guiding you safely. Stick with us and see how these tools can make your trading smarter and help you read market signals with confidence.
Fundamentals of Crypto Technical Analysis
Crypto technical analysis looks at past price moves and trading volumes to help spot patterns in the market. Instead of focusing on a coin’s deep details, like its true value or a company’s earnings, it zeroes in on charts and numbers. Think of it like checking your local weather forecast, you look at past weather patterns to predict if it's going to rain, just like reviewing price charts to guess when the market might change.
In the fast-paced world of crypto, this approach is a real lifesaver. Digital assets can swing wildly, making traditional methods less useful. Traders often rely on ideas like support and resistance levels, which are like the stop-and-go signs you see on busy streets. When prices break past these levels, it can mean big changes are coming. You also see familiar chart patterns like triangles, flags, and double tops or bottoms that help indicate potential shifts.
Using technical analysis gives you a clear plan. It lays out when to enter or exit a trade by studying past trends. Tools that pin down whether the market is bullish, bearish, or neutral tie your moves back to your goals and help manage risk. Overall, this method turns unpredictable market moves into a step-by-step strategy that feels both smart and practical.
Charting Platforms and Tools for Crypto Technical Analysis
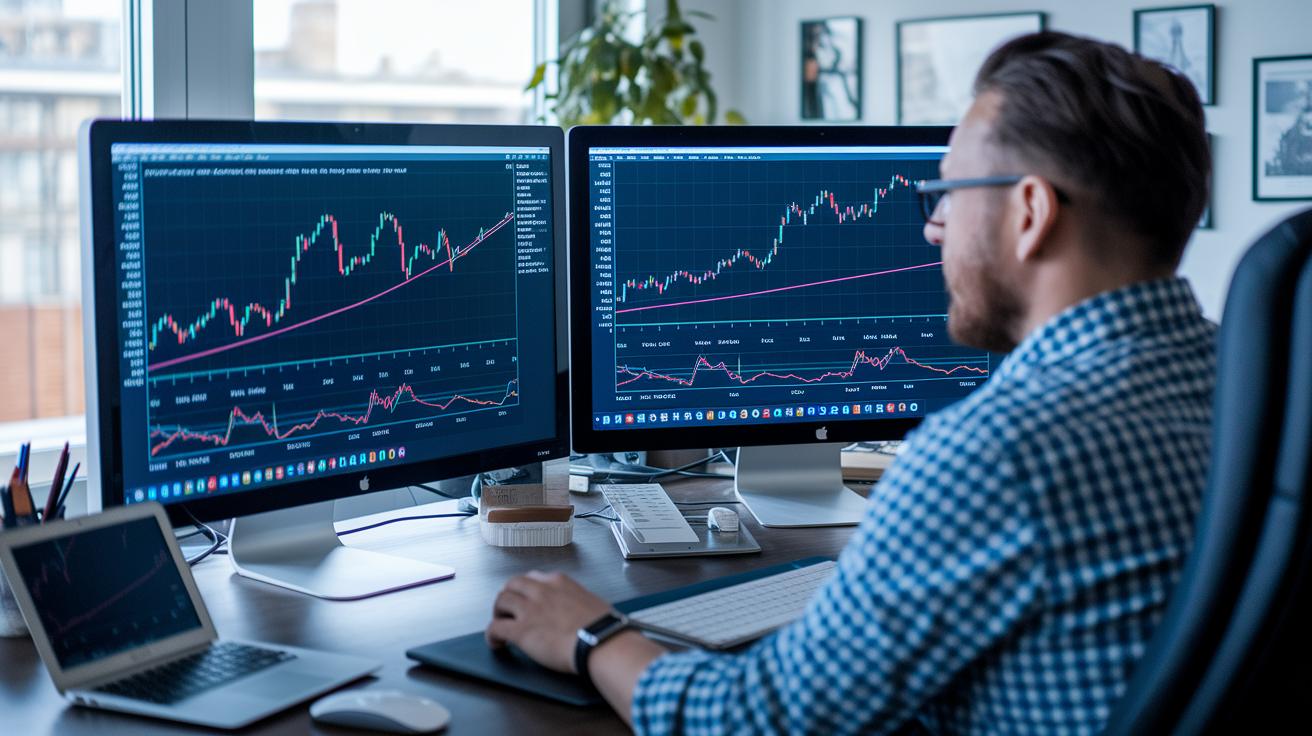
When you shop around for a charting platform, you want it to be fast and easy to use, like checking your daily schedule. Traders need quick data, user-friendly layouts, and a clear set of indicators. Tools such as the Kaufman Adaptive Moving Average (KAMA, a method to track price trends) can be a game-changer, especially when prices swing wildly.
- TradingView shows live data and comes with a large library of indicators, which is great for a rapid market snapshot.
- Coinbase Advanced Trading offers a clean, simple interface along with built-in technical tools to make analysis smoother.
- Coinigy pulls together data from multiple exchanges into one neat dashboard, so you get a broad view of the market.
- CryptoCompare gives strong market insights with charts you can customize to fit your style.
- TradingLite uses easy-to-read visual aids, like heat maps, to help you spot key market moves.
Using these platforms every day can make reading charts a regular part of your routine. Just like you wouldn’t start cooking without all your ingredients, having the right tool means you’re set to catch every signal and pattern before making any trading moves.
Key Technical Indicators in Crypto Analysis
Moving averages like SMA, EMA, and KAMA help smooth out crypto price data so you can see clear trends. They work by averaging prices over a set period. For example, KAMA reacts quickly during fast price moves, hinting at a potential trend change. When a short-term average crosses a long-term one, it's a clue that things might shift, much like spotting a new pattern in your daily routine.
The Relative Strength Index, or RSI, shows whether an asset is overbought (priced too high) or oversold (priced too low). It usually uses 14 periods and gives a value between 0 and 100. A score above 70 might mean the market is overheated, while a score below 30 suggests fewer buyers. Think of it like keeping score in a friendly game, where the numbers help signal when prices might start turning.
MACD stands for Moving Average Convergence Divergence and measures price momentum by comparing two lines: the MACD line and the signal line. When the histogram (the small bars you see) drops below zero, it indicates that momentum is slowing down. If it rises above zero, the price is picking up strength. This tool picks up subtle shifts that moving averages might miss, giving traders extra confidence when deciding to enter or exit a position.
Chart Patterns and Price Action in Crypto Technical Analysis

Price action analysis helps you understand market trends without needing complicated formulas. It looks at charts like a story, where every shape offers a hint about what might happen next. By watching these clues, you can notice when the market might change direction and adjust your moves. It’s like reading the market’s mood from simple visual signs.
Candlestick Signals
Candlestick patterns, like hammers, shooting stars, or engulfing patterns, can signal a change or continuation in price. For instance, if you see a hammer after a downtrend, it might mean buyers are stepping in, much like spotting a burst of sunshine on a gloomy day. These patterns make technical analysis feel more visual and easier to grasp.
Classical Chart Patterns
Classic patterns such as triangles, flags, head-and-shoulders, and double tops or bottoms give you clues about potential breakouts. Imagine sketching simple shapes on a notepad; each one helps point to where the price might sprint next. Recognizing these shapes can act like a map, showing you where support or resistance may form.
Trendline Methods
Drawing trendlines across swing highs and lows creates clear zones of support and resistance. Think of it like connecting dots on a graph to reveal the overall direction. These lines work as guides, helping you see if the price is likely to change course or continue on its path.
When you combine candlestick signals, classic chart patterns, and clear trendlines, you build a solid framework for trading. When these visual hints agree, they give you a firmer signal that other tools can back up, making your trading decisions more steady and informed.
Advanced Analysis Techniques in Crypto Technical Analysis
Advanced charting methods make crypto trading much more precise. They help you see key levels and shifts that might slip by unnoticed. Tools like Fibonacci retracements (which show potential support or resistance) mark important zones, while Bollinger Bands set clear upper and lower limits to track price swings. VWAP acts like a daily price guide, and order flow analysis with ATR-based stops shows you where to make your moves. These techniques turn a rough market read into a smart, data-driven strategy. They capture immediate price changes and also give you a feel for the overall market mood.
| Technique | Purpose | Typical Settings |
|---|---|---|
| Fibonacci | Identify potential support/resistance | 23.6%, 38.2%, 61.8% |
| Bollinger Bands | Measure market volatility | 20-period SMA, ±2 SD |
| VWAP | Set an intraday price benchmark | Volume-weighted average |
| ATR-based stops | Determine stop-loss and position size | Risk 1-2% capital |
| Order Flow | Gauge supply and demand shifts | Based on transaction volume |
Using several smart techniques together gives you a stronger trading signal. When Fibonacci levels line up with Bollinger Band data, it makes the signal even clearer. Mixing these insights with VWAP and ATR stops helps you decide when to enter and exit trades. By combining these methods, you can adjust your strategy as market conditions change, making sure no important clue is missed. This blend of tools builds a solid framework that lets you act quickly when opportunity knocks. Advanced approaches really do boost your trading edge.
Developing a Crypto Technical Analysis-Based Trading Strategy
Making a solid trading plan means mixing a few key parts. Start by using trend indicators, clear support and resistance levels, and easy-to-spot chart patterns. These clues work together to show you the best times to buy or sell altcoins. Add in risk management tools (like ATR-based stop-loss orders) and double-check signals using different indicators. This way, every trade fits into a plan you can repeat. Using a risk/reward ratio, such as 1:2, helps keep your losses small while making sure the gains are worth the risk. It’s a practical setup that lines up with your trading goals.
- Market Trend Identification – Look at overall price movements and how wild the ups and downs are. This helps you understand the current market and sets the stage for your trade.
- Signal Confirmation with Indicators/Patterns – Double-check your move by using at least two different technical indicators or chart patterns. This makes your signal stronger.
- Entry and Stop-Loss Placement – Pick your entry point based on clear chart clues, then use the ATR to figure out a stop-loss that limits your downside.
- Profit Target and Risk/Reward Calculation – Set a profit goal where your potential gain is at least double your risk. This ensures each trade has a good balance between risk and reward.
Before jumping into live trades, try backtesting your plan on old crypto market data. Look at past trends to fine-tune your strategy and adjust based on real outcomes. This step builds your trust in the method and sharpens your risk controls so you’re ready for live trading.
Final Words
In the action, this blog post outlined how crypto technical analysis empowers you to refine your investment choices. We explored the basics of using historical price data and key chart indicators, like moving averages, RSI, and MACD.
The overview also highlighted dynamic chart patterns and advanced methods that support better entry, exit, and risk control. Embracing crypto technical analysis can boost your confidence in managing risks while staying ahead of market trends.
FAQ
What is a crypto technical analysis book or PDF?
The crypto technical analysis book or PDF provides clear guidance on spotting chart patterns, reading trends, and managing risk. It breaks down volatile crypto markets into easy-to-understand steps.
What is a crypto technical analysis website?
The crypto technical analysis website displays live charts and key indicators, allowing you to track price trends and signal potential trade opportunities for better decision-making in real time.
What does crypto technical analysis today mean?
Crypto technical analysis today means using up-to-date price data and volume insights to forecast short-term market movements. It utilizes real-time charts and indicators for faster, informed trading decisions.
What is a crypto technical analysis app?
A crypto technical analysis app brings live charts, customizable indicators, and trading alerts to your mobile device, making it easier to monitor market trends and execute trades wherever you are.
What is a free crypto technical analysis course?
A free crypto technical analysis course offers beginner-friendly lessons on chart reading, indicator use, and risk management. It provides a solid starting point for building a repeatable trading strategy.
What is crypto technical analysis for beginners?
Crypto technical analysis for beginners explains how to read charts, identify trends, and set risk controls. It simplifies complex concepts so you can start spotting market signals with confidence.
Which technical analysis is best for cryptocurrency?
The best technical analysis for cryptocurrency blends tools like moving averages, RSI, and MACD. This combined strategy helps navigate price swings and improves accuracy when executing crypto trades.
Does technical analysis work on crypto?
Technical analysis works on crypto by studying past price and volume trends to predict future movements. While it isn’t foolproof, it can refine trade entries and exits when used alongside sound risk management.
What is the 1% rule in crypto?
The 1% rule in crypto advises risking only 1% of your total portfolio on any single trade. This method helps prevent large losses and keeps your overall risk manageable.
Can you make $100 a day with crypto?
You can make $100 a day with crypto by applying solid technical analysis, strict risk management, and a disciplined trading strategy. However, results depend on market conditions and your trading skill.


