
Ever wonder if crypto trends are random, or if they follow clear clues? Crypto analysis turns raw numbers into signals that show you when a smart trade might be a good idea. In this post, we explain the main methods using basic market facts, simple price charts, and blockchain data (which is information from the digital record). You'll learn how to turn everyday details into clear moves when deciding to buy, hold, or sell in the fast-changing world of crypto.
Comprehensive Crypto Analysis: Market Overview and Methodologies

Crypto analysis means checking different angles of digital tokens so you can make smart trading decisions. It shows you whether to buy, hold, or sell by turning numbers into clear ideas. Imagine looking at a daily update that tells you what’s moving and why. That clear view helps you catch good trends in a quick-changing market.
There are three main ways to do crypto analysis: fundamental, technical, and on-chain. Fundamental analysis looks at the big numbers like market cap and on-chain supply, plus things like network upgrades and development work. Technical analysis reviews past price info and tools like support and resistance levels, moving averages, RSI (a tool that shows if an asset is overbought or oversold), and MACD (a tool that tracks price momentum) to spot patterns for future moves. On-chain analysis, meanwhile, dives into blockchain data, checking active addresses, how many transactions happen, and how tokens move around, to see how the market feels. It’s like getting both the facts and the vibe of a digital asset.
Well-known sites like CoinGecko, CoinMarketCap, and TradingView combine these methods on one screen. Their real-time dashboards and charts make it simple to follow market trends. With a detailed Market Report, you get trustworthy and quick info that helps you keep an eye on the digital asset market and make smart moves with your investments.
Technical Crypto Evaluation: Chart Patterns and Indicators
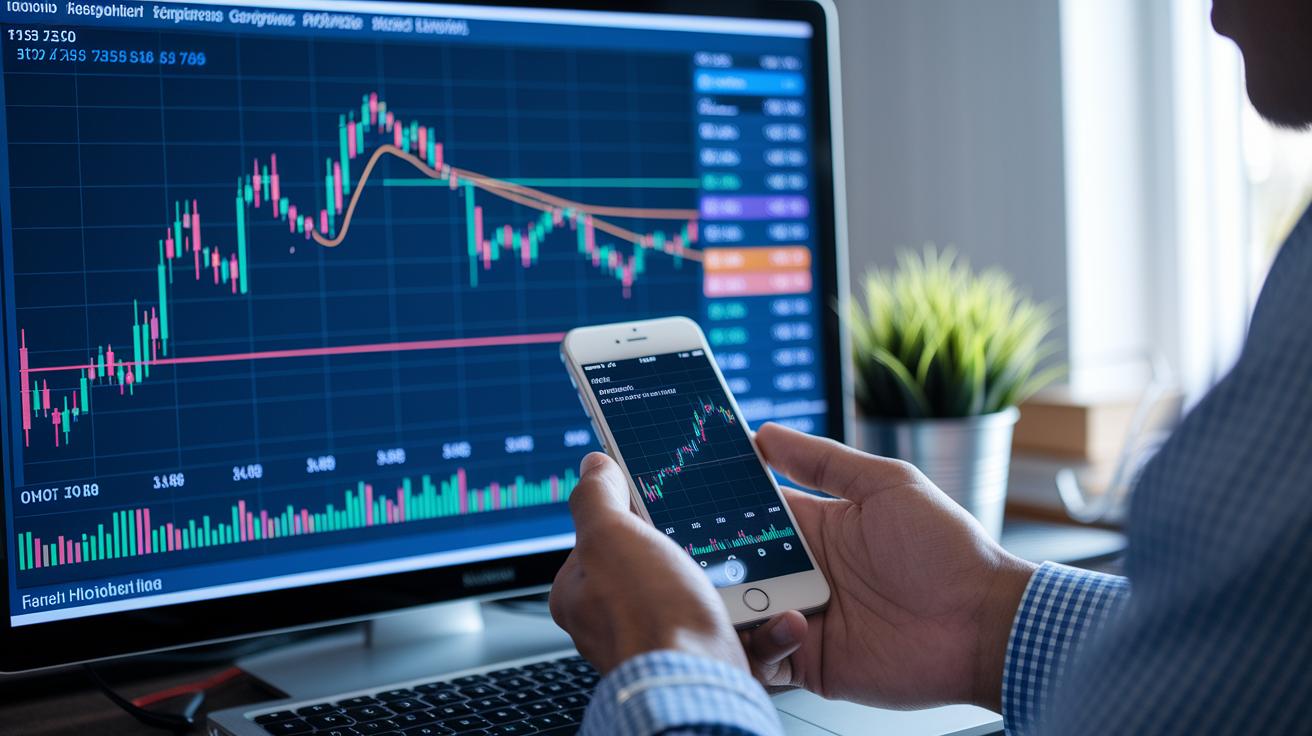
Technical crypto evaluation uses past price and volume data to help spot when the trend might change. Traders look at chart patterns as visual clues, kind of like reading cues on a sports field, to signal a breakout or a reversal. Patterns such as head & shoulders or double tops act like road maps that guide investors to possible turning points before big price moves happen. Noticing these signals fast is a smart way to stay ahead when the market shifts.
Indicators offer another level of insight. They can point out slight price changes and volume bursts that aren’t always obvious at first. Many investors lean on these clear visual cues to decide when to buy or sell. Some of the key indicators include:
| Indicator | Description |
|---|---|
| Moving average crossovers | (see Golden Cross Technical Analysis for details) |
| RSI divergences | Shows differences between price and momentum |
| MACD histogram signals | Highlights shifts in momentum trends |
| Bollinger Band squeezes | Indicates potential breakouts |
| Fibonacci retracements | Helps identify support and resistance levels |
| Ascending and descending triangles | Pattern signals for market boundaries |
Traders usually combine these tools to back up market directions. They might see a moving average crossover that hints at an uptrend, then look for confirming signs like an RSI divergence or a supportive chart pattern. This mix of analysis can cut down on false signals and give a clearer picture of market sentiment, helping you make quicker and smarter investment decisions.
Crypto analysis: Clear insights for smart investing
Volume analysis is key to understanding market shifts. When you see high trading volumes along with a price breakout, it usually means investors really believe in the move. But if the price changes without extra volume, that trend might be weak and could flip quickly. Think of it like this: a burst in volume during a breakout shows there's genuine buying or selling interest behind the price action.
On-chain analysis digs deeper into blockchain data that many might overlook. It looks at numbers like active addresses, transaction counts, and tokens moving in or out of exchanges. Sometimes, spotting whale transactions, or large transfers off an exchange, can give you an early hint about possible price swings. It’s a bit like checking the market’s pulse to see how much real activity is backing up the trends.
Sentiment scoring mixes on-chain data with online chatter, showing a clear bullish or bearish bias. When the blockchain flows line up with public opinion, you can feel more sure about the market signal. This blend of volume and on-chain insights offers a full view, helping traders make smarter choices based on genuine market sentiment.
| Metric | Insight |
|---|---|
| Active Addresses | Shows how engaged users are on the blockchain |
| Exchange Net Flow | Tracks tokens moving in or out of exchanges |
| Gas Fees | Indicates how busy the network is and how urgent transactions feel |
| Transaction Counts | Reflects overall blockchain activity |
| Whale Transactions | Highlights big asset moves that might signal upcoming price changes |
Algorithmic Market Predictions and Price Trend Forecasting in Crypto Analysis
More and more traders are turning to algorithmic forecasting as a modern way to predict price movements. These smart models look at past price and volume information to offer short-term forecasts that many investors rely on for quick insights.
At the heart of these models are basic statistical tools and machine learning. Simple methods like ARIMA, along with other machine learning techniques, study historical data to spot trends and turning points, often reaching about 60–70% accuracy over a week. AI even adds extra layers by watching social sentiment, network activity, and big events, like central bank meetings, to sharpen its predictions. For instance, if the system notices a sudden rise in trading volume along with a spike in buzz on social media, it might signal an upcoming price move. This mix of numbers and smart tech gives traders a clearer picture of the market.
Automated alerts then step in to notify traders when prices hit certain points or when sudden changes occur. These real-time signals help investors act quickly, making sure that they can adjust their strategies with confidence and speed.
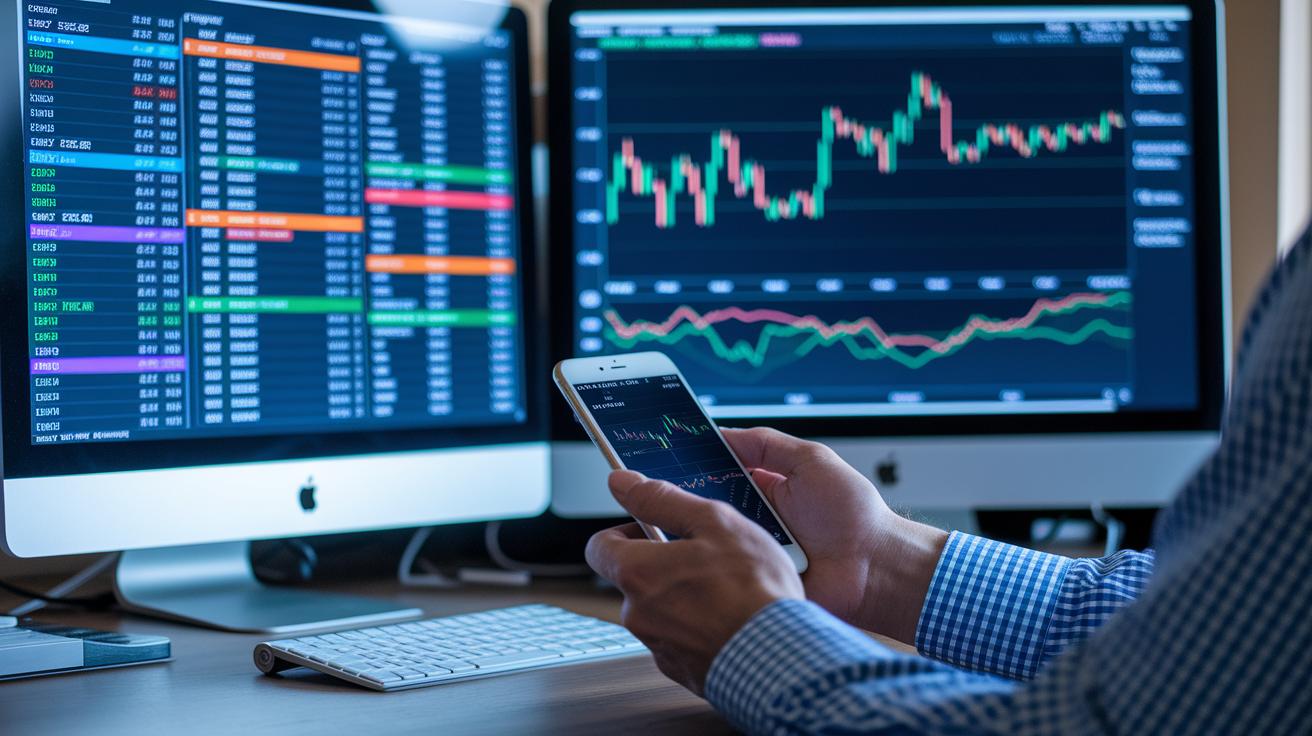
Crypto Analysis Tools: Data Visualization and Platform Comparison
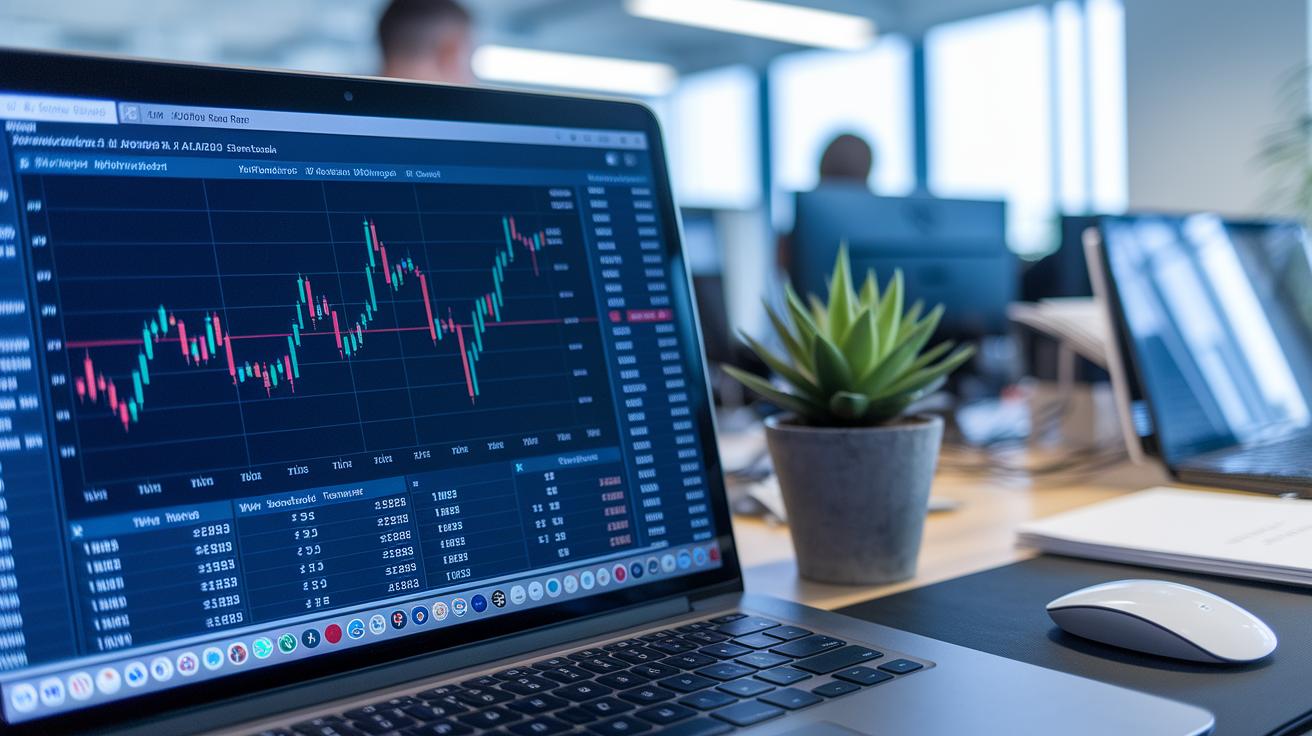
If you're exploring crypto markets, you'll find that platforms like TradingView, Glassnode, and CoinMarketCap/Gecko give you clear, custom views that turn basic market numbers into real insights. Think of it like switching on a dashboard where every key detail lights up for you. Whether you're checking out candlestick charts to see price trends or depth charts to gauge liquidity, you can set up a single view that tracks price, volume, volatility, and on-chain stats (important digital markers that show blockchain activity). This makes spotting changes and understanding market moves much simpler.
Every platform brings its own strengths, so you can pick one that fits your style. For example, TradingView stands out with its flexible chart tools and easy-to-read overlays, while Glassnode offers on-chain dashboards that reveal how the blockchain works. These visual tools turn raw numbers into clear signals that guide your investing moves. Here are some key dashboard widgets many investors trust:
- Volume profile for tracking trade activity
- Order-book depth to see liquidity layers
- Candlestick charts for visualizing price movement
- Network flow diagrams to understand token movement
- Real-time volatility and on-chain KPI metrics
Investment Risk Assessment and Crypto Market Cycle Evaluation
Risk measures show you how much your portfolio might fall when the market takes an unexpected turn. Tools like Value at Risk (VaR), maximum drawdown, and the Sharpe ratio (a measure that compares return and risk) help you understand how deep that drop could be. For instance, if your portfolio falls by 10% during a sudden move, these numbers can give you a clear picture of that decline.
Crypto markets move in clear stages: accumulation, mark-up, distribution, and markdown. During accumulation, prices gather strength quietly before taking off. Bitcoin halving events, for example, often hint at these changes, kind of like noticing the moment when a gloomy sky starts to clear. This cycle view helps you set proper expectations for both gains and setbacks.
Real-time tools like the BVIX index keep you updated on fast changes by tracking token volatility. History shows that bull runs tend to stretch to about 300 days after a halving, while bear markets might last nearly 450 days. Using these indicators lets you gauge market mood and adjust your risk strategy with confidence.
Final Words
In the action, we explored a robust mix of crypto analysis methods, from combining fundamental numbers and trends to using technical charts and algorithmic forecasts. We examined how clear data visualization and on-chain signals build a solid view of market sentiment.
The insights shared here aim to help you manage personal finances and boost financial understanding. Embrace the tools and trends we discussed so you can confidently get the most out of each market cycle. Stay optimistic and keep growing your investment know-how.
FAQ
What is a crypto analysis website?
A crypto analysis website is a platform that provides real-time market data, combining technical trends, fundamental insights, and on-chain metrics to help users evaluate digital tokens.
What does crypto analysis today mean?
Crypto analysis today means looking at current market assessments, including price trends, technical signals, and data-driven insights, to guide trading decisions.
What is a crypto analysis chart?
A crypto analysis chart visualizes price movements, volume, and technical indicators to help spot trends, support/resistance levels, and potential turning points.
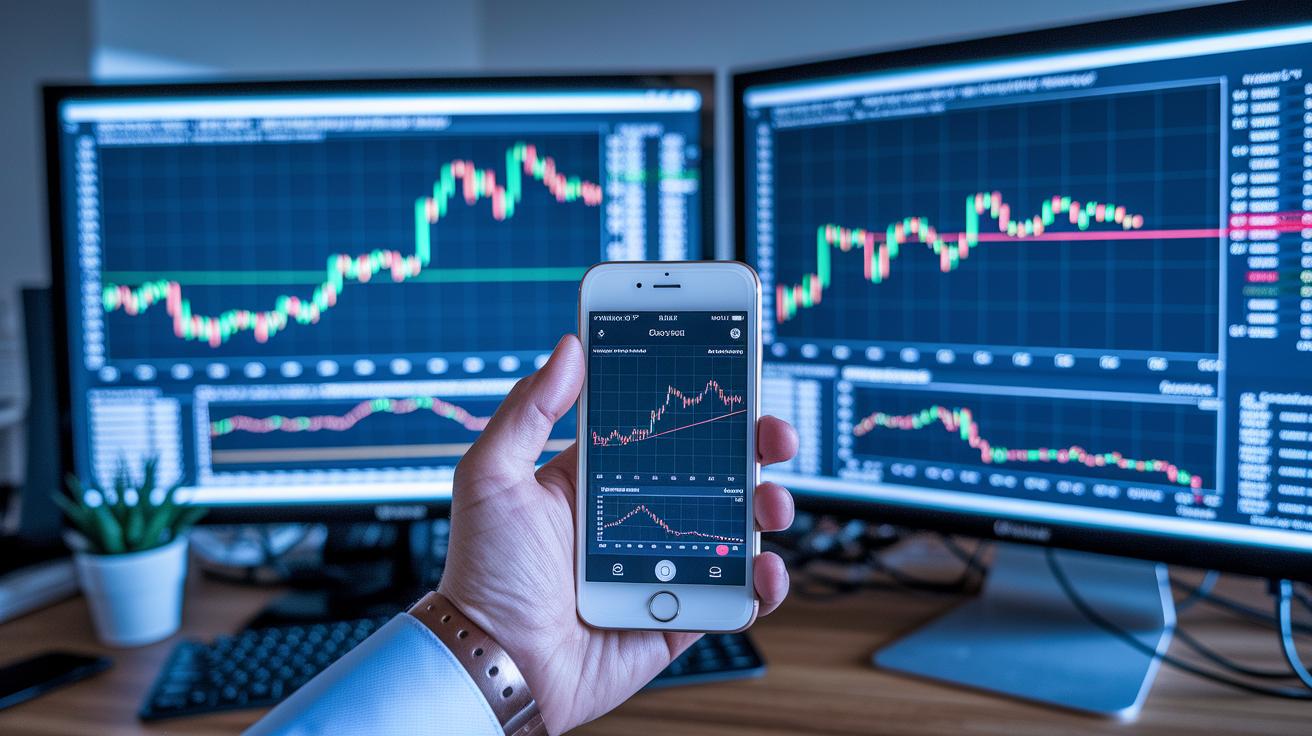
What is a crypto analysis app?
A crypto analysis app offers mobile-friendly tools to monitor market data, track technical signals, and receive real-time alerts while on the go.
What are crypto analysis tools?
Crypto analysis tools include platforms and software that provide charts, indicators, and on-chain data to support informed trading and investment choices.
What is crypto analysis AI?
Crypto analysis AI refers to systems that use machine learning and data mining to combine historical data, social sentiment, and network activity for forecasting market trends.
What does a crypto analysis course cover?
A crypto analysis course explains key methods like fundamental, technical, and on-chain analysis, helping learners understand market data and spot trading opportunities.
What is a crypto analysis PDF?
A crypto analysis PDF is a downloadable guide that offers detailed explanations, charts, and methodologies to help readers learn about market trends and techniques.


