

Ever felt stuck in the wild world of crypto? I know it can be confusing. But with a bit of care and a few clear steps, you can go from guessing to really understanding what’s going on.
This guide breaks crypto analysis into three easy parts. First, get to know a coin by checking out its main details. Next, use simple market charts to see trends, just like glancing at a friendly roadmap. Finally, take a look at blockchain data (that’s the record of every crypto move) for extra hints.
Each tip helps you see the full picture of today’s market and even gives a sneak peek at what might come next. Ready to learn and feel confident in your crypto journey? Let’s dive in.
Comprehensive Crypto Analysis Guide for Investors
A smart way to study crypto combines three main methods: fundamental analysis, technical analysis, and on-chain analysis. Each one gives a different view of market trends, and together they form a complete toolkit for looking at digital assets. By checking details from economic blueprints to market trends, you get a clearer picture of how things are now and what might come next.
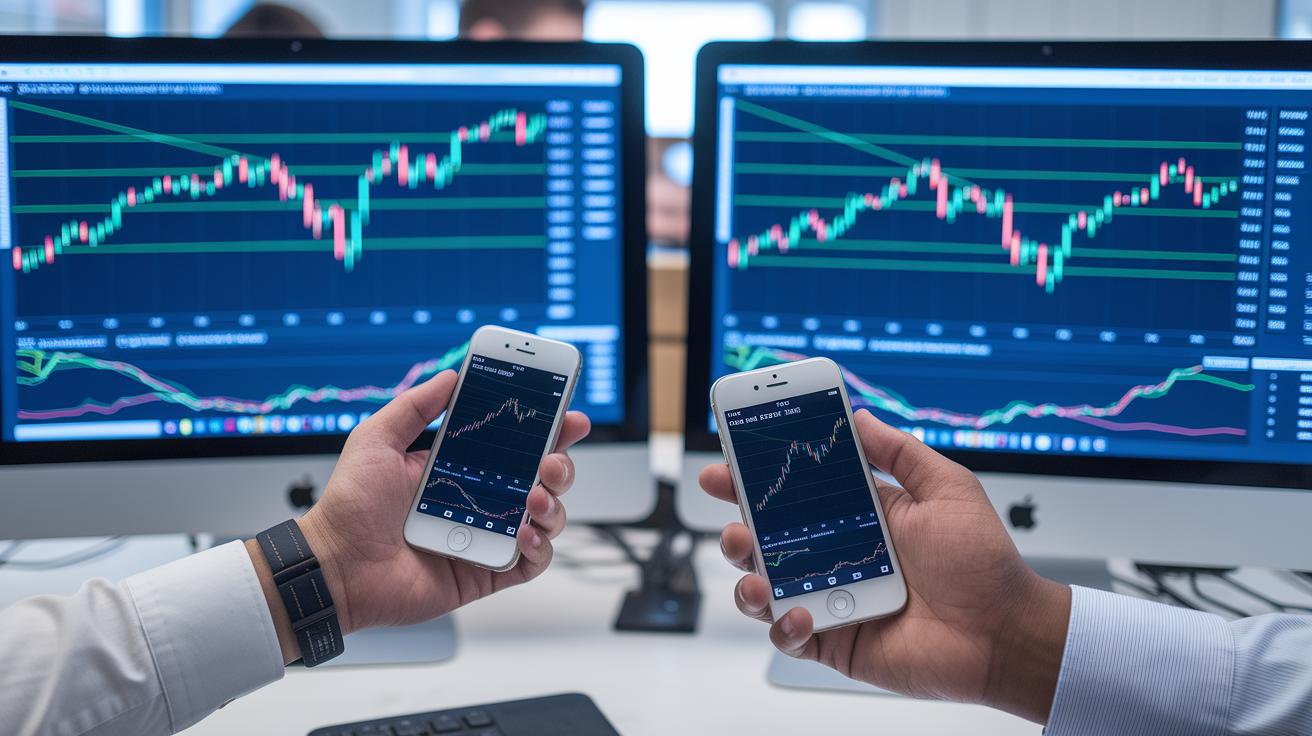
Technical analysis looks back at past prices and trading volume to spot trends and possible changes. It uses simple charts, think candlestick, bar, or line graphs, that are a bit like a car’s dashboard telling you when to speed up or slow down. Tools like moving averages, RSI (Relative Strength Index, which gauges if an asset is overbought or oversold) or MACD (a method to track momentum) help you see shifts in market strength. It’s a quick way to figure out the best moments to dive in or step out.
Fundamental analysis digs deep into what makes a digital asset valuable. This means reading white papers, checking out the background of the project team, and looking at roadmaps for clear milestones. It also reviews tokenomics (the basics of how tokens are made and spread out) to see if the asset is built to last. Think of it like checking a company’s financial health before you decide to invest.
On-chain analysis adds another perspective by looking directly at blockchain data. It keeps an eye on things like transaction counts and big wallet moves to show what the market is really feeling. When you see lots of activity, it might mean that a phase of buying is on the way, which can hint at future market shifts.
By mixing these approaches, you get a strong, well-rounded plan that helps you make smart decisions in the ever-changing crypto world.
Fundamental Analysis Techniques for Crypto Valuation

Crypto fundamental analysis is all about figuring out if a digital coin will stand strong in the long run. It combines number-crunching like market cap and circulating supply with deeper looks at technical details, such as what’s written in a project’s white paper, who’s behind the project, and how active the developers are. This way, you get a good picture of a coin’s potential.
Start by diving into the white paper. Think of it as the instruction manual for a cool new gadget. It tells you how the project works and what technology powers it. Then, take a look at the team behind it. Check out their past work and see if they've successfully delivered projects before. Want to go even deeper? There’s more info on investment analysis and portfolio management available out there.
Next up, study the project’s roadmap. A reliable roadmap shows clear steps and realistic dates for when things will happen. For instance, if a coin rolled out its beta version on time, that’s a strong sign the team is on the ball. It builds a solid case that the coin might grow in steady, long-term value.
Then, break down the tokenomics. This means looking at how tokens are supplied, distributed, and what incentives they offer. Ask yourself how features like inflation schedules, vesting periods, and burn mechanisms might affect the coin’s price and stability. A well-laid-out token model can help reduce risks from sudden market shifts.
Finally, check out community metrics. Look at details such as the number of active addresses, how frequently developers update the code, and how engaged the community is online. A buzzing, interactive community often mirrors investor confidence and shows that the coin is backed by real support in the market.
Technical Analysis Methods in Crypto Chart Reading

Timing crypto trades is a lot like taking a basketball shot. You use clear, technical signals to decide when to shoot and when to hold back. Even a quick look at a chart can hint at where prices might move next.
Charts come in different types, and each one tells you something unique. Candlestick charts show detailed info like the open, high, low, and close prices. They help you spot patterns easily. Bar charts keep it simple by highlighting the range of prices, and line charts give you a clear view of overall trends. For example, if you notice a candlestick pattern that shows a sudden jump in price, it might be a good time to enter or exit a trade.
- Relative Strength Index (RSI): shows how fast the price is moving.
- Moving Averages (SMA/EMA): reveal the overall trend.
- MACD: points out when momentum is shifting.
- Bollinger Bands: mark the range of price ups and downs.
- Fibonacci Retracement: finds potential support or resistance levels (areas where the price may bounce).
- Volume Profile: looks at the amount traded at different prices.
- Trendlines: help you spot when prices break out of their usual range.
Using more than one indicator can boost your confidence in a trade. For instance, if the RSI shows that things are overbought and the moving averages signal a downtrend, it might be wise to take a step back. Many traders line up MACD signals with Fibonacci levels to cut through any confusing cues. Imagine seeing the MACD dip as the price bounces off a Fibonacci level, this could be just the moment to secure your profits. Checking these signals across various charts can help you make smart, confident trading choices.
On-Chain Analysis Strategies Using Blockchain Data

On-chain analysis uses the blockchain's open record to watch what’s happening on the network in real time. It’s a handy tool that shows shifts in market mood and cycles. By checking unchangeable transaction records, investors can spot trends and get ready for changes before they spread to the whole market.
Important numbers like active addresses, transaction counts, and total value locked (TVL, which tells you how much money is in smart contracts) form the heart of on-chain analysis. Exchange wallet balances also give clues by showing money moving in and out. Each of these figures helps us understand market behavior, making it easier to tell busy periods from quieter times.
When these metrics spike, it usually signals an accumulation phase, that is, active addresses or transaction volumes jump up as many investors start buying. On the flip side, when the numbers drop, it can indicate a distribution phase where investors begin selling off their holdings. A rising TVL often shows that funds are being set aside for the long run, which can help ease market ups and downs.
For example, there was a time when big transfers from whale wallets happened during a rising hash rate. The historical data pointed out that these spikes were a sign of a cycle about to reverse. By watching these trends, investors were able to guess when shifts were coming, adjust their strategies, and feel more confident about their market moves.
Evaluating Crypto Market Trends and Sentiment
Crypto market moods really drive how prices move. When people feel extreme fear or overwhelming greed, prices can change in a flash. Keeping an eye on what’s being said online and in the news helps you catch these shifts and make smarter trading decisions.
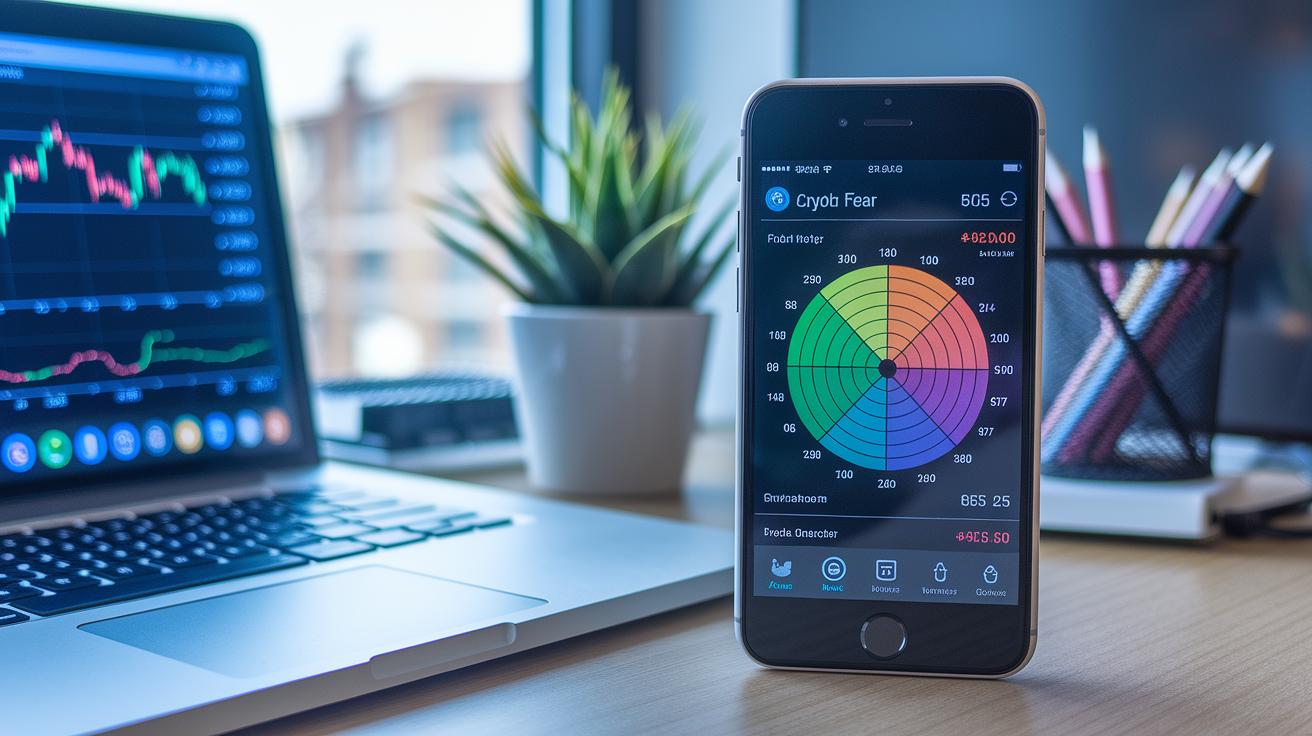
There are handy tools that collect social media chatter and news headlines to give you a live read on investor feelings. A popular one is the crypto fear and greed index, which works like a mood meter for the market. For example, when the index hits above 80, it often signals that a short-term pullback might be on the way. It’s kind of like having a radar that lets you know when emotions might push prices up or down.
News can also be a big game changer. Major headlines, whether it’s about regulatory actions or a new exchange listing, often send ripples through the market. Did you know that when bullish sentiment doubles, prices can jump by about 12% on average? That’s why staying updated with the latest news can really help you get ahead.
Think about a day when a new exchange listing caused a 15% price jump. By watching both the mood indicators and breaking news in real time, you can feel more confident about timing your trades just right.
Risk Management and Valuation Frameworks in Crypto Analysis
Crypto markets are known for their fast, wild swings, so having a solid risk management plan is a must. A steady review of your digital assets helps you set clear guidelines while keeping emotions in check.
Using stop-loss orders and keeping your trade size tight, usually risking just 1–2% of your portfolio, acts like a safety net. It automatically closes your trade before losses pile up, letting you keep control even when the market surprises you.
Measuring volatility is key to understanding market moves. Tools like Average True Range (ATR), Bollinger Bands' width, and historical volatility give clear signals about market pressure. They help you decide if the current conditions are too choppy or if there's a stable moment for a trade.
Liquidity is another important piece. By checking 24-hour trading volumes and examining order book depth, you can avoid bumps like slippage. Looking at bid-ask spreads ensures you enter or exit trades without hidden costs eating into your gains.
When you’re valuing digital assets, building a strong framework is essential. Models like token discounted cash flow (DCF) equivalents, peer benchmarks, and risk-adjusted return calculations show you the potential gains and losses. With a risk-reward ratio of at least 1:2, these methods balance protection with opportunity, fitting each trade into your broader plan to safeguard your capital and boost returns.
Essential Tools and Platforms for Crypto Research
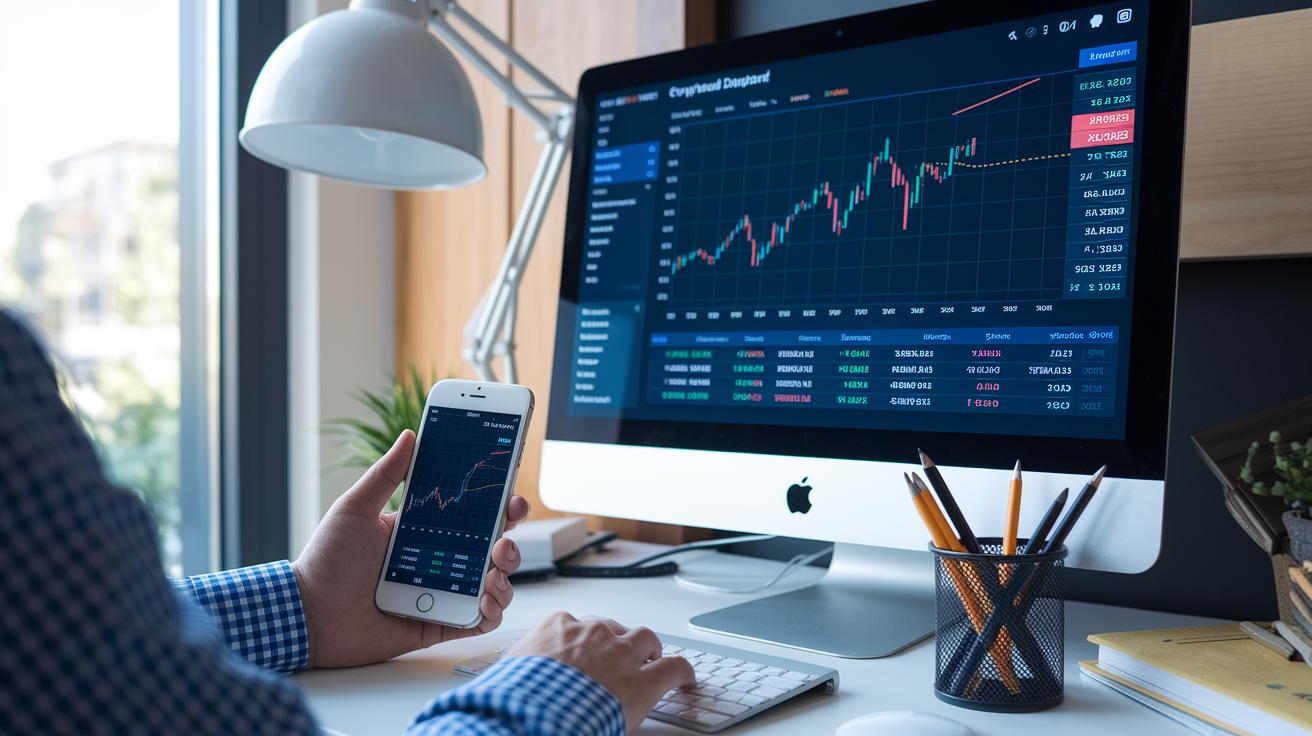
When it comes to crypto, having the right tools can really speed up your decisions. These digital helpers turn tricky market data into clear, easy steps, almost like having a trusty compass while you navigate the crypto world. Imagine a dashboard where every metric lights up in real time, giving you a clear picture of market trends.
- TradingView: It comes with advanced charts and lets you create custom indicators using Pine Script.
- Glassnode: This tool offers on-chain details (insights into blockchain activity) so you can see investor mood and movement.
- CoinGecko: It lays out market data and token details in a way that's simple to understand at a glance.
- Dune Analytics: Perfect for a deep dive, it lets you run custom SQL queries on blockchain data.
- CoinStats: Acts as a handy portfolio manager that keeps track of your digital coins and organizes your investments.
Choosing the right platform really depends on your experience. If you’re just starting out, go for dashboards with preset analyses and helpful guides. And if you’re more experienced, you might like tools that offer custom queries, algorithmic trading tips, and live features to match your need for deep insights.
Integrating Crypto Analysis Methods for Informed Decisions

When you blend fundamental, technical, and on-chain analysis, you get clearer trade signals and feel more sure about your decisions. Combining these methods gives you a full picture of a coin’s performance, digging into every detail. It helps you rule out false alarms by checking both classic charts and real on-chain data like whale buying patterns and busy transaction trends.
Begin with a basic check using fundamentals. Look at white papers, the strength of the team, and tokenomics (the study of a token’s economic value) to see if a project is solid. Then, spot technical hints like chart breakout patterns and other signals that point to potential market shifts. Finally, back up your findings by watching on-chain signals such as rising active addresses or big changes in exchange balances. This step-by-step plan makes sure every decision rests on several layers of insight.
It’s important not to lean on just one signal. Compare different measures like market cap-to-volatility ratios, daily transaction counts, and developer activity to balance your view. Also, keep a detailed research log with all your notes so you can review and update your insights as new data comes in.
Since markets change over time, it’s smart to update your analysis regularly. By checking how each method fits into your overall strategy, you can fine-tune your approach. This keeps your analysis sharp and ready for the evolving trends in the digital market.
Final Words
In the action, this article broke down the core crypto analysis methods, fundamental, technical, and on-chain, showing how they work together to guide smart investment decisions. We touched on chart signals, white paper reviews, and even on-chain data, providing a clear framework for blending ideas into a solid approach.
By combining these methods, you get a well-rounded view on how to analyze crypto and make choices that boost your confidence. Stay curious and keep refining your strategy, it can really pay off.
FAQ
How do you analyze crypto on Reddit and for beginners?
The method to analyze crypto on Reddit and as a beginner involves checking community trends, reading discussion threads, and verifying tips with trusted sources. This builds a solid foundation for making informed decisions.
How do you verify and analyze cryptocurrencies before investing, including tokens and niche platforms?
The approach to verifying and analyzing cryptocurrencies relies on fundamental research. Review white papers, team credentials, tokenomics, and community feedback using reputable websites, PDFs, and specialized tools for a sound investment strategy.
What does the 1% rule in crypto signify?
The 1% rule in crypto means limiting risk per trade to 1% of your portfolio. This cautious approach helps protect your capital against market swings and supports disciplined risk management.
What is considered the best tool or app for crypto analysis?
The best crypto analysis tools vary by user needs. Many prefer TradingView for charting, Glassnode for on-chain data, and CoinGecko for market details. Choose a platform that fits your research style and ease of use.
Can ChatGPT analyze crypto charts?
ChatGPT can offer insights into crypto chart trends and patterns, but it doesn’t replace dedicated charting software. Use its guidance alongside specialized tools for a more complete technical analysis.
What does the 30-day rule in crypto mean?
The 30-day rule in crypto often refers to holding periods or observed market trends over a month that help indicate shifts in investor sentiment. It’s an approach used for evaluating potential longer-term impacts on prices.
How do coins analysis and crypto recommendations work?
Coins analysis and crypto recommendations blend quantitative data, like market cap and on-chain statistics, with qualitative factors such as community feedback and news. Combining these insights helps build a balanced view before investing.


